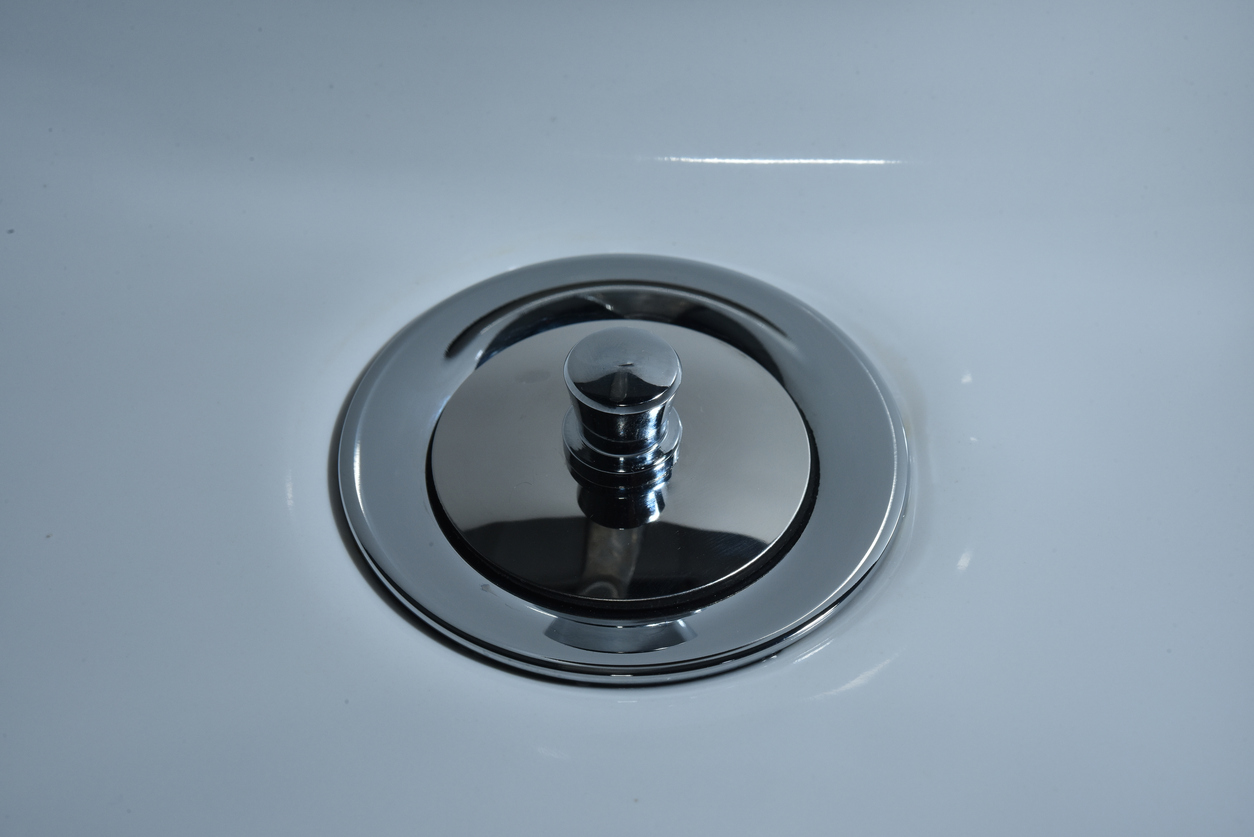
20+ Common Bathtub Drain Stopper Types in 2025 – Which is best for your bathtub?
Choosing the right bathtub drain stopper is essential for creating a comfortable and functional bathing experience. With over 20 common
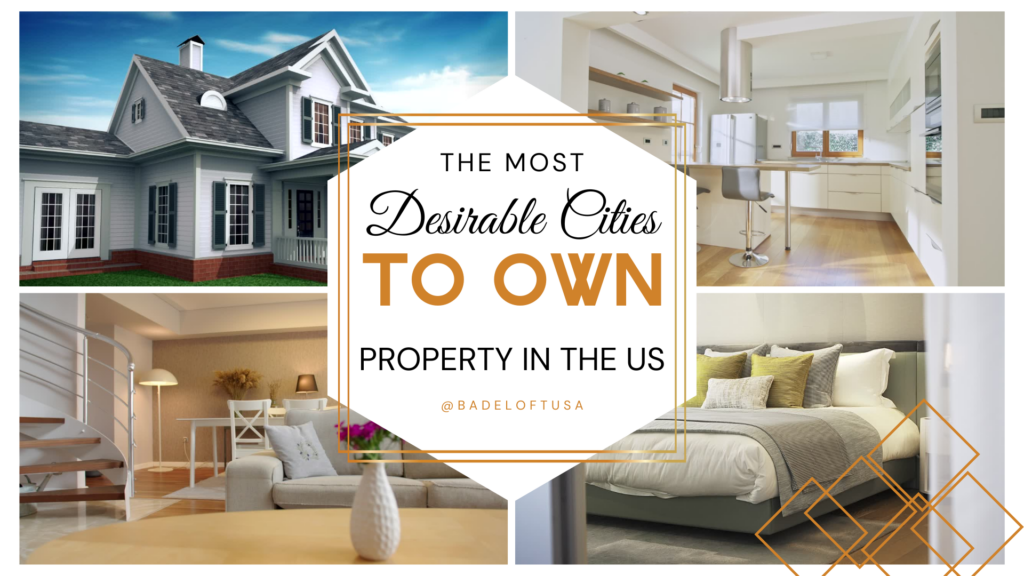
If you’re thinking about buying a home in 2025, be prepared to compete – especially if you live in certain cities. A new study by Badeloft USA reveals where demand for housing is far outpacing supply, with some U.S. cities seeing hundreds of interested buyers for every home on the market.
By analyzing online search volume compared to the number of homes listed for sale, the study identifies where competition is most intense. It also offers insights into home prices, sizes, and affordability trends across the country.
The following cities have the highest number of searches per available home—an indicator of just how many people are looking to buy in markets with limited inventory:
| City | Searches per available house |
| Washington | 461.36 |
| San Diego | 216.76 |
| Fresno | 197.76 |
| Los Angeles | 126.08 |
| Sacramento | 114.33 |
| Kansas City | 109.73 |
| Albuquerque | 107.45 |
| Louisville | 96.24 |
| Boston | 89.74 |
| San Jose | 79.30 |
Washington, D.C. stands far above all other cities, with more than 460 searches per available house — more than double that of second-ranked San Diego. This suggests an extreme mismatch between buyer interest and available supply.
California cities take four of the top six spots, showing the state’s housing crisis isn’t just about high prices—it’s also about competition. Even smaller or less traditionally competitive markets like Fresno show intense activity, signaling a wider national trend where demand is spilling over from more expensive metros.
Demand is only one part of the equation. Some of the most competitive markets are also among the most expensive in the country. Here’s how the top 10 cities rank for average home price:
| City | Average house price |
| San Jose | $1,426,853.00 |
| San Francisco | $1,242,637.00 |
| San Diego | $1,005,710.00 |
| Los Angeles | $948,383.00 |
| Seattle | $851,513.00 |
| Honolulu | $773,409.00 |
| New York City | $763,861.00 |
| Boston | $745,827.00 |
| Washington | $589,180.00 |
| Miami | $584,695.00 |
San Jose ranks as the most expensive housing market, with homes averaging nearly $1.43 million. Other California cities — San Francisco, San Diego, and Los Angeles — dominate the top of the list, reflecting the state’s ongoing housing affordability challenges.
Notably, even cities outside of California, like Seattle, Honolulu, and New York City, show average home prices well over $750,000. For buyers in these areas, price remains a major barrier — regardless of how many other people are looking.
For buyers prioritizing square footage, these cities offer the largest average home sizes:
| City | Average house Size (ft) |
| Fort Worth | 2,255 |
| Nashville | 2,109 |
| Austin | 2,081 |
| Albuquerque | 2,078 |
| Charlotte | 2,049 |
| Houston | 2,041 |
| Indianapolis | 2,027 |
| Las Vegas | 2,011 |
| Kansas City | 2,008 |
| Tucson | 2,005 |
Fort Worth, TX leads the list with homes averaging over 2,250 square feet, offering significantly more room than typical homes in dense coastal markets. Cities like Nashville, Austin, and Albuquerque also provide generous living space – ideal for buyers who value square footage over downtown proximity.
Interestingly, both Albuquerque and Kansas City show up in the top 10 for both buyer demand and home size. This combination of strong interest and livable home design suggests these markets are emerging sweet spots for buyers looking to maximize value. In contrast, cities like San Jose and Boston, though high in demand, don’t appear on this list, signaling that homebuyers there may be sacrificing space for location or amenities.
You can access the complete research here.
This study investigates housing demand across major U.S. cities (with more than 500K population) by analyzing online search interest in relation to housing availability. Here’s how the findings were developed:
Search volume was collected for queries like “buy a house in [city]” to gauge consumer interest. This served as a proxy for housing demand.
We gathered data on:
The key metric – Searches per Available House – was calculated by dividing the number of search queries by the number of active listings. This figure reflects buyer pressure per listing.
To enrich the story, house prices and average sizes were included to help readers understand how value, affordability, and space intersect with demand.
Badeloft is dedicated to helping homeowners make informed decisions about their bathrooms. We adhere to strict editorial guidelines to ensure our content is accurate, trustworthy, and useful.
Request free stone resin and stainless steel material samples. Delivered to your door.
Choosing the right bathtub drain stopper is essential for creating a comfortable and functional bathing experience. With over 20 common
A soaking tub is defined by one thing: depth. Where a standard alcove tub sits around 14 inches deep, a

Spring is when most bathroom remodels get serious. The weather breaks, contractors open up, and that upgrade you have been
A Japanese soaking tub, known traditionally as an ofuro, is designed for one purpose: full-body immersion. Unlike Western bathtubs built
Request your free material sample below. By submitting, you agree to receive occasional product updates and offers from Badeloft. Unsubscribe anytime.
"*" indicates required fields